Eagles 2016-2020 Usage Ranks
| Category | 2016-2020 Total | League Rank |
|---|---|---|
| Eagles fourth-down attempts | 146 | 1st of 32 |
| Eagles two-point attempts | 48 | 1st of 32 |
About me
I am a Super Bowl-winning football analytics and game-management leader with more than a decade of NFL experience across the Philadelphia Eagles, Jacksonville Jaguars, and Las Vegas Raiders, plus FBS Power 4 consulting experience.
My career has focused on turning advanced football research into practical decisions coaches can use: fourth downs, two-point decisions, clock management, opponent scouting, weekly game planning, self-scouting, and live game-management communication.
With the Eagles, I worked across analytics, coaching, and game management during one of the league's most influential decision-making eras, including the Super Bowl LII championship season. Over my five headset seasons with Doug Pederson, Philadelphia led the NFL in fourth-down and two-point attempts by wide margins. My innovative research in 2017 led the Eagles to lead the NFL in QB sneak attempts over the next four seasons and helped move the modern QB sneak conversation forward. We were also the first team to use the "Down 8, Go for 2" strategy in normal conditions, a strategy that has been used 49 times by 23 different franchises since then.
I later served as Director of Coaching/Football Analytics for the Jaguars, helping build research systems and staff-facing decision processes during a rapid turnaround from the No. 1 overall pick to a playoff win in the same season. That run included the data-driven "Down 4, Go for 2" strategy in a comeback playoff win.
Most recently, I served one season as Head Coach Research Specialist for the Raiders under Pete Carroll, directing coaching analytics and providing real-time recommendations on the headset. In the widely cited public nfl4th/rbsdm model, the 2025 Raiders ranked 1st of 32 in fourth-down decision-making and 1st of 32 in least win probability lost after the organization had ranked 31st and 32nd in those metrics the prior two seasons.
I have also consulted at the FBS Power 4 level for a program that won twice as many games over a three-year time frame. The team also led college football in rushing yards per carry and had a season averaging over 500 yards per game.
I am currently available for select consulting opportunities.
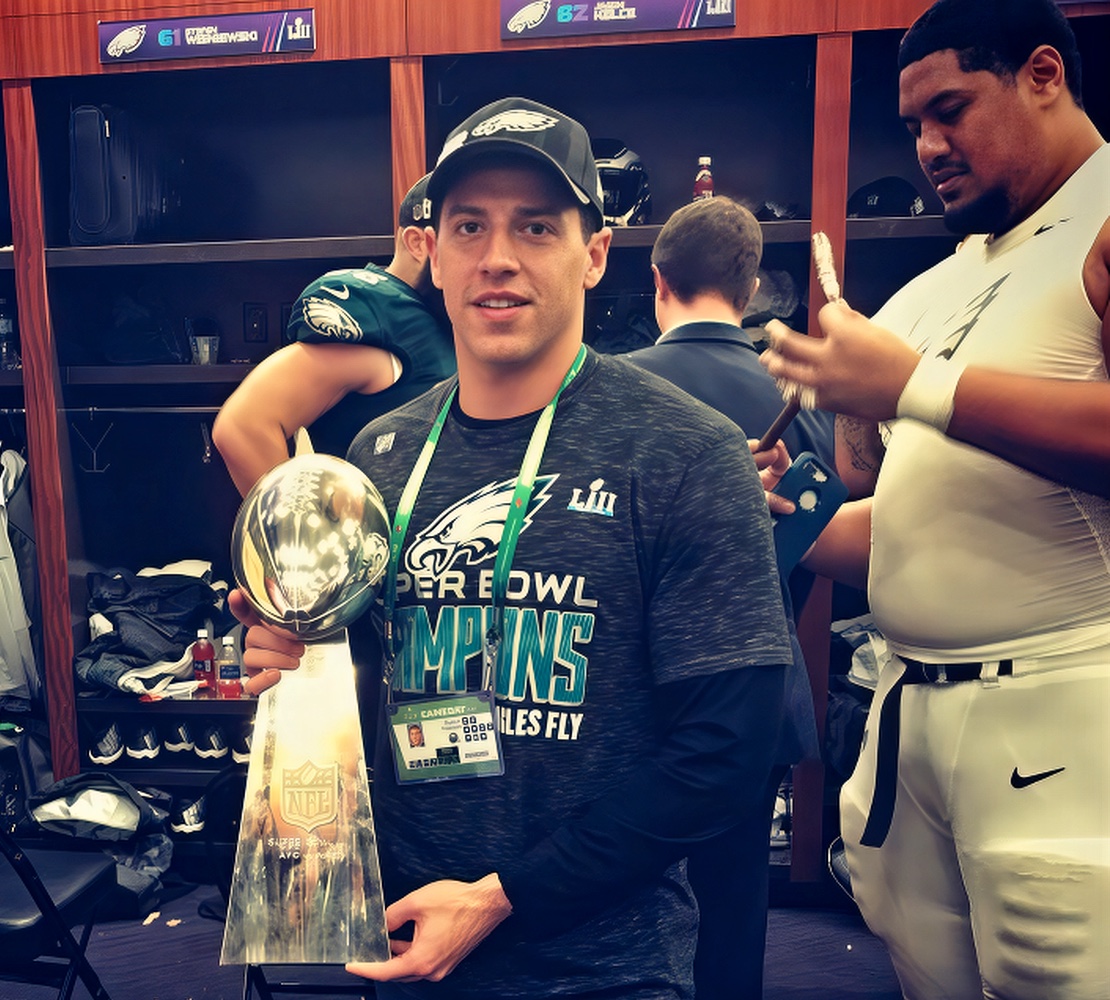
Over five headset seasons, Philadelphia led the NFL in fourth-down attempts by 25% and two-point attempts by 60%.
Eagles 2017 and Raiders 2025 both ranked 1st of 32 teams in the public nfl4th fourth-down decision rankings.
Director-level analytics work during the first NFL season where a team went from the No. 1 overall pick to a playoff win the same year.
Multiple seasons consulting for an FBS Power 4 program that won twice as many games over a three-year time frame, led college football in rushing yards per carry, and averaged over 500 yards per game.
Proof
Selected examples of team staffs, strategies, and applied research showing up in measurable football outcomes.
| Category | 2016-2020 Total | League Rank |
|---|---|---|
| Eagles fourth-down attempts | 146 | 1st of 32 |
| Eagles two-point attempts | 48 | 1st of 32 |
| Window | QB Sneaks | Context |
|---|---|---|
| Eagles 2016 | 2 | Baseline before the 2017 offseason research presentation. |
| 2017 offseason | Presented research to the coaching staff advocating for league-leading QB sneak usage. | |
| Eagles 2017-2020 | 51 | Most in league League-leading QB sneak usage after the research was presented. |
| League-wide impact | 74 -> 342 | League-wide quarterback sneaks increased from 74 in 2016 to 342 in 2025. |
| Team Window | Correct Fourth Down Decision Rate per Analytics | Correct Decision Rate Rank | WP Loss per Game Kicking in Go Situations | WP Loss per Game Kicking in Go Situation Rank |
|---|---|---|---|---|
| Raiders 2025 | 75.0% 12 go decisions / 16 opportunities | 1st of 32 Best in league | 0.637 WP lost per game | 1st of 32 Best in league |
| Raiders 2023-2024 | 35.5% 22 go decisions / 62 opportunities | 31st of 32 Near bottom | 3.233 WP lost per game | 32nd of 32 Worst in league |
Decision rate: go when model says greater than 1% win probability gain. WP loss: win probability loss per game kicking in go-for-it situations.
Explore
Contact
For consulting, speaking, podcasting, media appearances, research projects, AI implementation, or decision tools, email is the best first step.
PaganettiRyan@gmail.com